
The use of Machine Learning (ML) components in safety-critical or financially critical systems is challenging. At Fraunhofer IESE, we address this challenge by systematically engineering comprehensive multi-layered safety concepts and explicitly considering sources of uncertainties. This specifically includes situations at runtime for which ML components were not trained. In this blog post, we present the concept and the principle of using statistical distance methods for runtime assessment of contextual relevance. In part 2 of this series of blog posts, we further extend the presented approach to include a context uncertainty estimation metric.
Using statistical distance measures for evaluating scope compliance at runtime (Part 1)
In recent years, advances in computation power have strongly fueled the development of Machine Learning (ML) approaches, leading to excellent results in various applications. From non-critical domains, such as retail, natural language processing, or agriculture, to critical domains, such as transportation and healthcare, ML algorithms are used in a wide range of tasks, ranging from crop yield prediction to autonomous driving. In healthcare, ML is used in making early diagnoses of diseases, improving patient outcomes, and reducing risks. In the financial sector, ML algorithms are employed for fraud detection, risk assessment, and automated trading. These applications rely on vast amounts of data to identify patterns and anomalies that human analysts might miss. However, the implementation of ML in these critical areas necessitates rigorous validation, transparency, and compliance with regulatory standards to ensure reliability and trustworthiness.
Machine Learning uncertainties
There are various aspects, such as data and the environment, that can affect the outcome of ML models and lead to uncertainties in the outcome. The algorithm used and the model architecture may also result in uncertainties of ML models. Moreover, the dataset itself may introduce some uncertainties to ML models, and the inherent stochastic nature of some ML algorithms can add further uncertainties. Other uncertainties include uncertainties due to environmental changes in the operational context or external factors that were not present during the training phase. These uncertainties can also arise when a model trained on specific data fails to generalize well to new, unseen data, particularly if the new data comes from a different distribution. Additionally, the relevance of certain features may diminish, leading to decreased predictive accuracy. All these uncertainties can significantly affect a model’s performance and reliability. Managing these scope uncertainties is essential for ensuring the reliability of Machine Learning models in real-world applications.
Scope compliance uncertainties
One basic principle that helps ensure that the operational domain aligns with the domain for which the ML model was designed is to make sure that a comprehensive and representative dataset is available. Other than that, regular updates of the training dataset to include new patterns and variations help to maintain the model’s relevance.
Continuous monitoring and performance tracking in the production environment make it possible to detect domain shifts early, allowing for timely retraining or adjustments.
One method for checking the operating scope and comparing it with the designed scope is to use a statistical distance-based approach, which allows for comparing the statistical properties of the operational data with those of the training data. By establishing a baseline during design time, setting thresholds, and planning adaptation mechanisms for reacting to threshold violations, such approaches can be used for dynamic monitoring and management of uncertainties.
Statistical distance-based context relevance evaluation: SafeML
In recent years, we have developed a statistical distance-based approach called SafeML (Aslansefat, Sorokos, Whiting, Tavakoli Kolagari, & Papadopoulos, 2020). The approach is illustrated in the figure below.
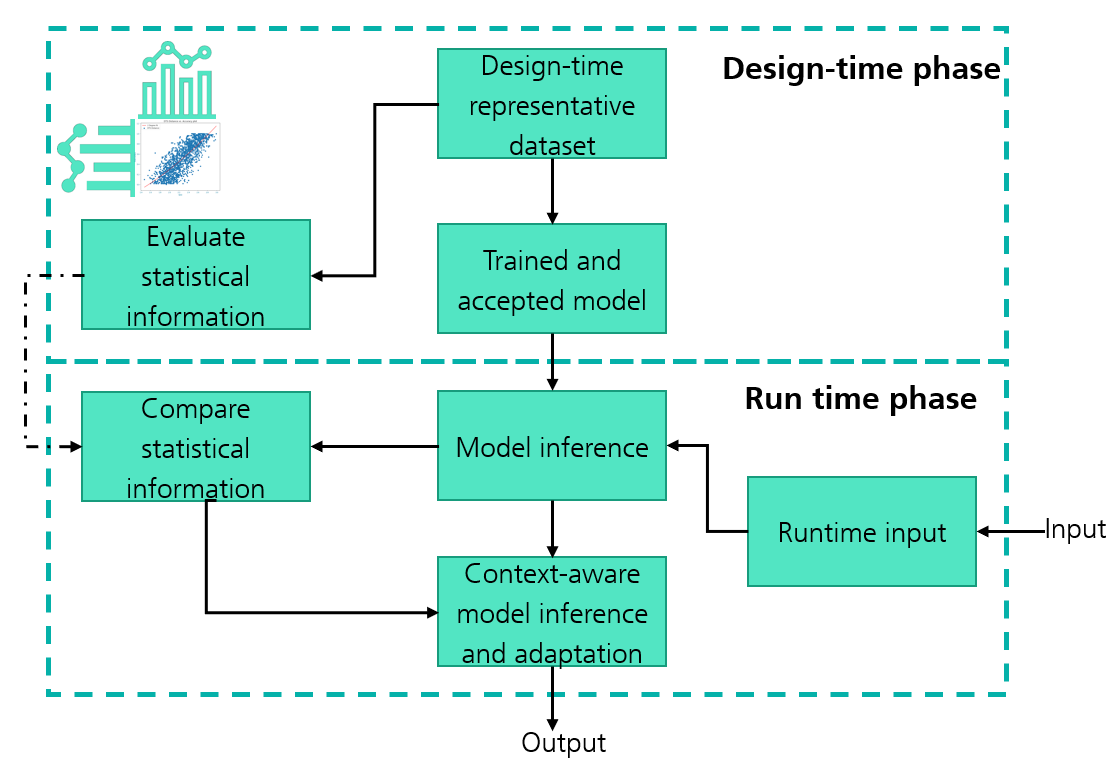
The SafeML approach has two lifecycle phases, the design phase and the runtime phase. It is presumed that the basic requirement of having a comprehensive and representative dataset is fulfilled. During the design phase, relevant statistical information is selected and computed. During the runtime phase, relevant information is computed for the data encountered at runtime. Depending on whether the computed statistical information is within the designed thresholds, a decision can be made at runtime as to whether to accept or disregard the output of the ML model and/or trigger predefined adaptation mechanisms.
In practice, distribution functions (such as the Cumulative Distribution Function (CDF) and the Equivalent Cumulative Distribution Function (ECDF)) are used as statistical information extracted at design time. This is then compared with the statistical information of the data encountered at runtime. The distance between these distribution functions is computed and is then used as an indicator for the similarity or dissimilarity of the runtime data compared to the data used during the design phase for training the models. The distance functions used can vary and may include Wasserstein Distance, Kolmogrov-Smirnov, Carmen Von Mises, etc. (Panaretos & Zemel, 2019). In our work, we also investigated how the distance threshold and the sample size required at runtime can be further derived (Al-Harith et al., 2022). To demonstrate the working principle of SafeML, we selected two safety-critical applications. (i) a traffic sign recognition example, and (ii) a person detection example.
Example use: Traffic sign recognition
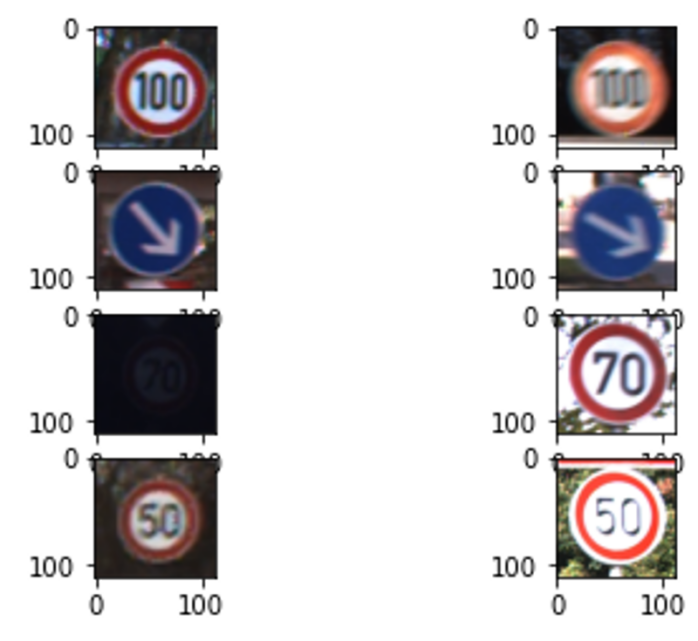
For the first example, we selected a traffic sign recognition example. We used the publicly available German Traffic Sign Recognition Benchmark (GTSRB) dataset (Stallkamp , Schlipsing , Salmen , & Igel, 2011). GTSRB is a comprehensive collection of images designed for training and evaluating Machine Learning models in the task of traffic sign recognition. It comprises thousands of images of traffic signs belonging to 43 different classes, including speed limits, no entry signs, and various warning and mandatory signs. Each image is labeled with the corresponding traffic sign class, and metadata such as the bounding box coordinates are included for precise localization. The images were captured under diverse conditions, featuring variations in lighting, weather, and perspective, which provide a robust challenge for recognition algorithms. A sample of the images can be seen in the figure below.
For the model, we used AlexNet. AlexNet (Krizhevsky, Sutskever, & Hinton, 2023) is a pioneering convolutional neural network (CNN) architecture that has significantly advanced the field of Deep Learning, particularly in computer vision. Developed by Alex Krizhevsky, Ilya Sutskever, and Geoffrey Hinton, AlexNet won the ImageNet Large Scale Visual Recognition Challenge (ILSVRC) in 2012 by a substantial margin, reducing the top-5 error rate to 15.3% from the previous best of 26.2%. The architecture consists of eight layers: five convolutional layers followed by three fully connected layers.
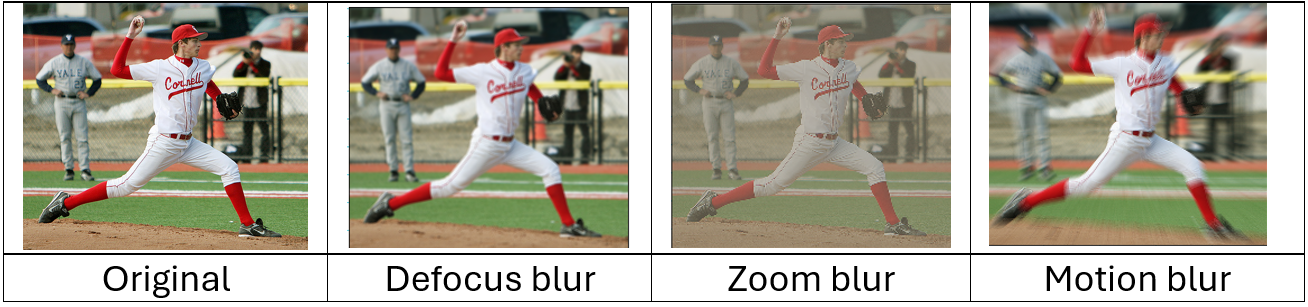
To generate the out-of-domain dataset, we used image corruptions (Michaelis, et al., 2019). Image corruptions can be effectively used to simulate out-of-domain data by introducing various types of distortions and alterations to the images that deviate from the conditions seen during the training phase. These corruptions can include noise (Gaussian), blurring (motion blur, Gaussian blur), weather effects (snow, fog), etc. By applying these corruptions, we can create a diverse set of test images that allow us to evaluate the robustness and generalization capability of Machine Learning models.
Experimental demonstration
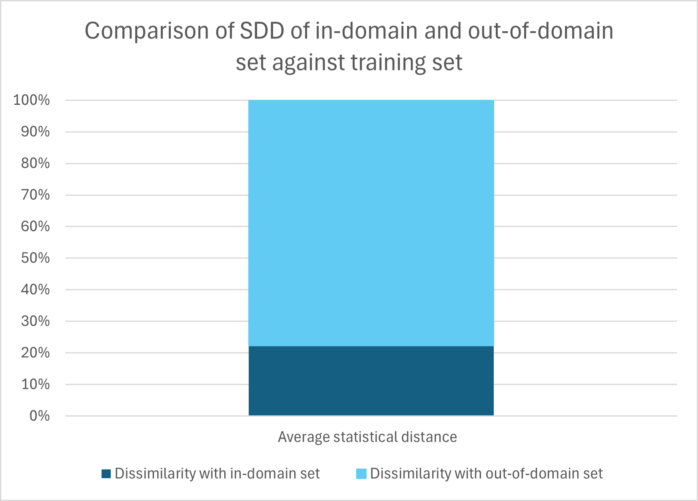
For the experiment, we calculated the statistical distances between the samples from the test set and the samples from the training set. We considered the data from the test set to be “in-domain” data. We further calculated the same distances from the samples from the “out-of-domain” (OOD) data that we generated using image corruptions, and the sample from the training set. The obtained statistical distances – let’s call them statistical distance dissimilarity (SDD) – provide an indication of how similar/dissimilar two samples are. The graph below shows the average comparison of the SDD between the two instances over all distance metrics.
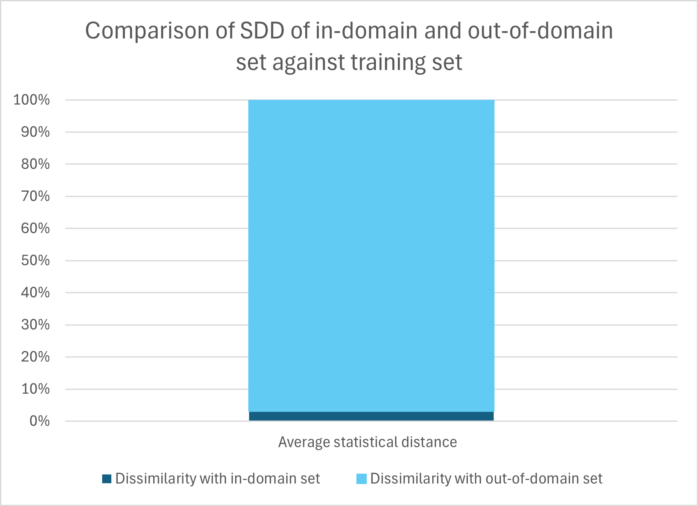
Looking at the graph, the SDD between the in-domain set and the training set is much lower than the SDD between the out-of-domain set and the training set. This validates the principle of SafeML.
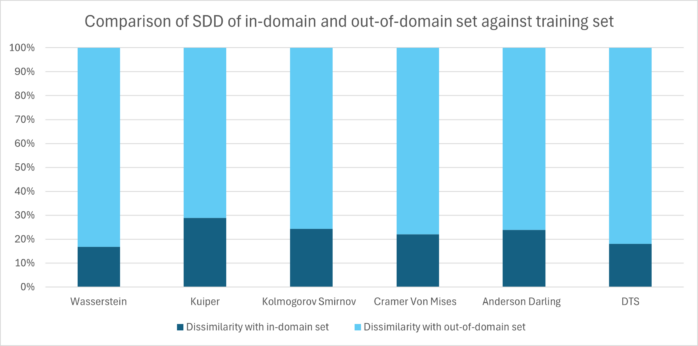
The graph below depicts a comparison of each distance metric tested.
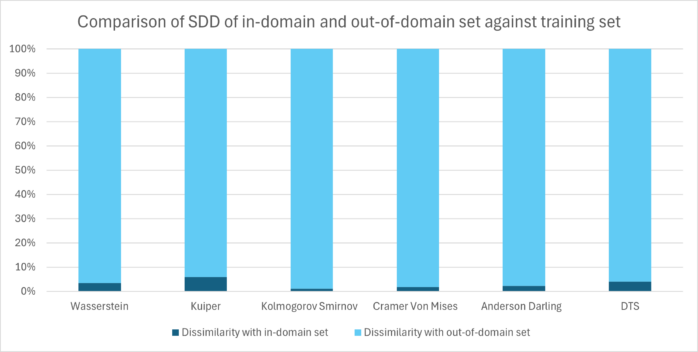
It can be seen from the graph that all distance metrics exhibit consistent behavior in distinguishing the in-domain and out-of-domain sets.
Example use: Person detection
In this example, we used a person detection use case for which we selected the publicly available Common Objects in Context (COCO) dataset (Lin, et al., 2014). The COCO dataset is a large-scale, richly annotated collection of images primarily used for advancing research in computer vision. Released by Microsoft, COCO provides thousands of images encompassing 80 object categories commonly found in everyday scenes. COCO is widely used for benchmarking and training Machine Learning models for tasks such as object detection, segmentation, and image captioning. We used a filtered dataset of COCO (filtered for person class only) and used it only for the detection task. As with the traffic sign recognition example, we used image corruptions to simulate out-of-domain data. Some samples are depicted below.
For the detection, we used the YOLOv8 (You Only Look Once version 8) model (Redmon & Farhadi, 2018). YOLOv8 is an advanced iteration of the popular YOLO family of real-time object detection models, renowned for its speed and accuracy. It was fine-tuned for the person detection task and then used for performing the experiments.
Experimental demonstration
As with the traffic sign recognition example, we first performed the experiment by calculating the statistical distances between the in-domain set (test set) and the samples from the training set and then between the samples from the out-of-domain (corrupted set) and the sample from the training set. Just as in the traffic sign recognition example, the comparison graph of SDD for the person detection example also shows a significantly elevated SDD of the out-of-domain set compared to the training set.
The graph below shows that the dissimilarity of the in-domain set is much lower compared to that of the out-of-domain set, regardless of the distance metric used.
Conclusion
In this blog post, we focused on the limitations of Machine Learning models and particularly on the uncertainties arising from insufficient model fit, i.e., the data encountered during operation being dissimilar to the training data. We examined this by proposing a statistical distance-based method that can effectively identify such uncertainties at runtime. We demonstrated and discussed our approach based on two examples. In the next part of this blog post series, we will further demonstrate how this principle can be tailored to obtain a scope compliance uncertainty metric at runtime. So, stay tuned for the next part! If you are interested in the topic or have any questions or comments, please feel free to contact us.
Further blog posts on the topic:
Dealing with uncertainties of Machine Learning components (Part 2)
References
Al-Harith, F., Sorokos, I., Schmidt, A., Akram, M., Aslansefat, K., & Schneider, D. (2022). Keep Your Distance: Determining Sampling and Distance Thresholds in Machine Learning Monitoring. Model-Based Safety and Assessment: 8th International Symposium, IMBSA 2022, Munich, Germany, September 5–7, 2022, Proceedings. Munich.
Aslansefat, K., Sorokos, I., Whiting, D., Tavakoli Kolagari, R., & Papadopoulos, Y. (2020). SafeML: Safety Monitoring of Machine Learning Classifiers through Statistical Difference Measure. International Symposium on Model-Based Safety and Assessment. Lisbon.
Krizhevsky, A., Sutskever, I., & Hinton, G. (2023). ImageNet classification with deep convolutional neural networks (AlexNet) ImageNet classification with deep convolutional neural networks (AlexNet). Actorsfit. Com.
Lin, T.-Y., Maire, M., Belongie, S., Hays, J., Perona, P., Ramanan, D., . . . Zitnick, C. (2014). Microsoft coco: Common objects in context. Computer Vision–ECCV 2014: 13th European Conference, September 6-12, 2014, Proceedings, Part V 13. Zurich, Switzerland.
Michaelis, C., Mitzkus, B., Geirhos, R., Rusak, E., Bringmann, O., Ecker, A., . . . Brendel, W. (2019). Benchmarking Robustness in Object Detection: Autonomous Driving when Winter is Coming. arXiv preprint arXiv:1907.07484.
Panaretos, V., & Zemel, Y. (2019). Statistical aspects of Wasserstein distances. Annual review of statistics and its application, 405-431.
Redmon, J., & Farhadi, A. (2018). Yolov3: An incremental improvement. arXiv preprint arXiv:1804.02767.
Stallkamp , J., Schlipsing , M., Salmen , J., & Igel, C. (2011). The {G}erman {T}raffic {S}ign {R}ecognition {B}enchmark: A multi-class classification competition. IEEE International Joint Conference on Neural Networks, (pp. 1453-1460).